First things first, I’d like to warn you that this article contains my quarterly income report for Q1, 2016.
What that means is that this article talks about money… More specifically, it’s about money I’ve earned as a freelance WordPress developer working for Codeable, LinkedIn, Clarity, and GoDaddy during Q1, 2016.
If you’re not a fan of this topic then I’d encourage you to visit my blog and choose another article of mine to read. Perhaps you’d be more interested in learning why I publish my income reports in the first place?
Spoiler alert: I believe transparency trumps secrecy.
I’d also like to mention that the intent of this article is to inspire, not to boast. This is my personal story, my journey, in becoming a freelance WordPress developer. My goal is to show other developers what’s possible as a freelancer and hopefully inspire someone to pursue a fulfilling career of their own as a freelancer.
Now, before we dive any further into this topic together we need to get on the same page about one thing. This isn’t some magic, get-rich-quick, overnight success, fantasy nonsense. This is real income produced by completing real work for real clients. I earned this $36,850.86 in Q1 by working for it, not wishing for it.
My quarterly income report from Q1, 2016 contains detailed monthly metrics of my freelance journey as a certified expert WordPress developer for Codeable.io, LinkedIn ProFinder, Clarity.fm, and GoDaddy Pro.
File "/nas/content/live/nathanello/wp-content/uploads/2016/07/q1-2016-monthly-comparison.xlsx" does not exist.
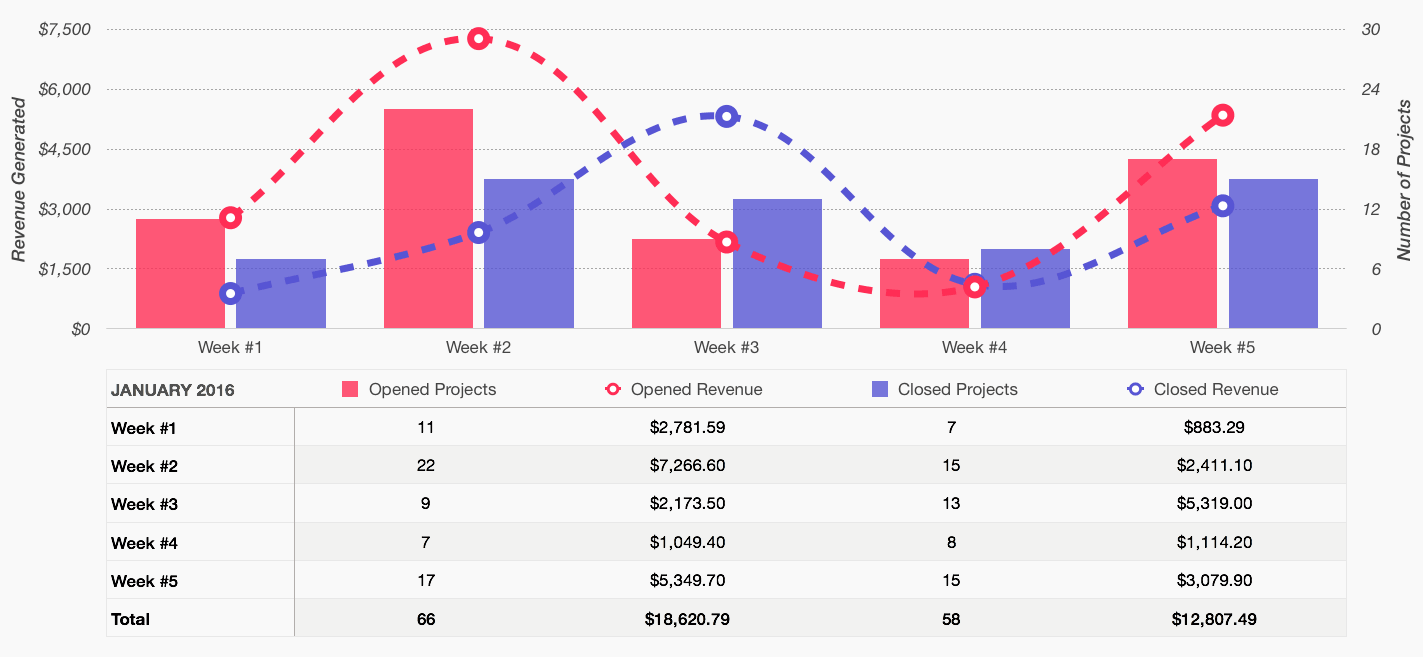
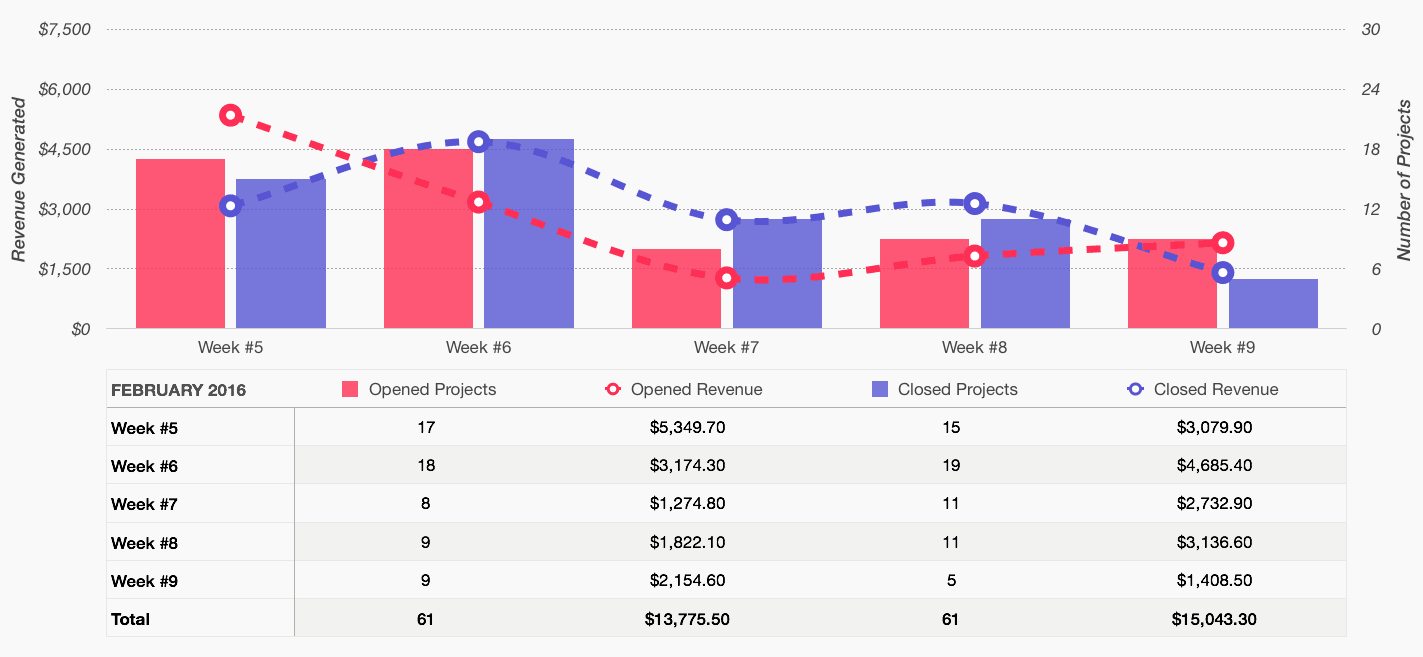
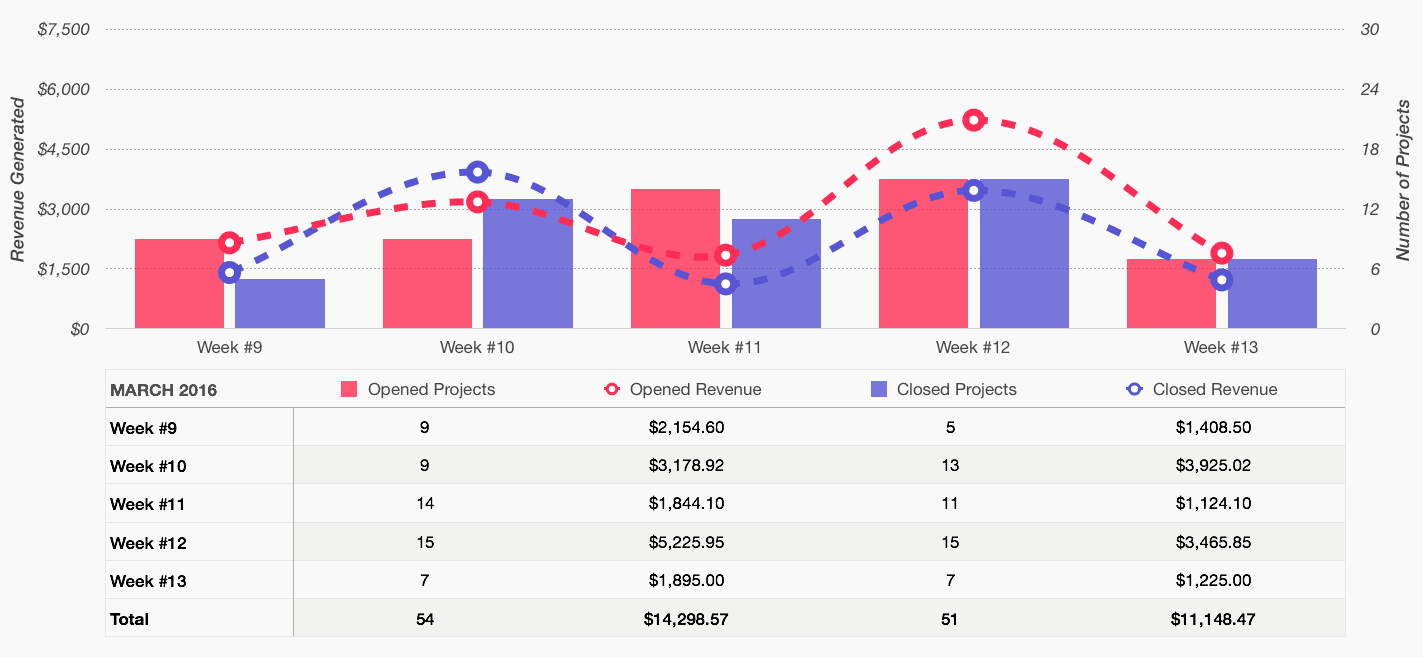
On these charts, opened projects refers to clients who have hired me to work on their projects while opened revenue represents the deposits they’ve placed for their work to be completed. Clients on Codeable deposit 100% of their project costs up front which is then placed into escrow until they mark the project as complete. Projects marked as complete are represented by projects closed and closed revenue
*Note: You can click on any of the graphs showcased below to zoom in and see a larger version.
[separator type=”tall” size=”” icon=”usd”]
Month #1 — Freelance Income Report For January 2016
January was a great start to 2016 both financially and productively. I set a new personal record for opened project revenue in a single week [week #2] at $7,266.60 for 22 new projects. Many clients’ budgets have been reset for the new year and what better time for us to get back to work than the 2nd week of January?
Overall my performance this month was stronger than last month [December 2015]. My total opened projects increased by 47% from 38 to 56, while revenue increased by 38% from $7,559.49 to $10,433.19.
*Note: By now you’ve probably noticed a difference in the total income reported in my text vs the chart above, that’s because January ended on the 3rd day of week #5. In order to provide the most accurate week-over-week comparison I’m showcasing the full week #5 which includes 4 days from February 2016.
[separator type=”tall” size=”” icon=”usd”]
Month #2 — Freelance Income Report For February 2016
February was another great month for me both productively and financially. Although I didn’t open as many new tasks as I did in January (down 14% from 56 to 48) or open as much new business (down 40% from $16,260.69 to $9,748.80) that’s okay. Freelancers must understand the needle won’t always point north.
Fortunately for me, not all metrics were down this month. I experienced slight growth in both projects completed (up 8% from 48 to 52) as well as total revenue earned (up 1% from $12,773.19 to $12,929.20).
My average task size dropped a bit this month, but completing more tasks helped made up the difference.
*Note: Again, you’ve probably noticed a difference in the total income reported in my text vs the chart above, that’s because February ended on the 4th day of week #9. In order to provide the most accurate week-over-week comparison I’m showcasing the full week #9 which includes 3 days from March 2016.
[separator type=”tall” size=”” icon=”usd”]
Month #3 — Freelance Income Report For March 2016
Onto March now, which was the opposite of February. Again, another great month for me both productively and financially but this month I opened more new tasks (up 6% from 48 to 51) while opening more new business (up 35% from $9,749.80 to $13,160.07). Unfortunately, not all metrics went up this month.
I experienced a slight decline in both projects completed (down 2% from 52 to 51) as well as total revenue earned (down 14% from $12,929.20 to $11,148.47).
My average task size dropped again this month which was solely responsible for the decrease in revenue.
Compared to last quarter (Q4, 2015) my total new tasks opened dropped by 12% (from 176 to 155) while the total new revenue opened increased by 13% ($34,581.65 to $39,170.56). An increase of 40% in my average task size ($173.30 to $244.05) is responsible for my revenue increasing even though productivity declined.
However, just because my productivity declined by 15% (from 178 to 151) doesn’t necessarily mean I’ve had a worse quarter. Oh, and just FYI I’m calculating “productivity” based solely on the total number of tasks completed, the actual time I spent working on these projects is not factored in.
So even though Q1, 2016 appears to have been less productive than Q4, 2015 there was still an overall increase in revenue of 19% (from $30,847.59 to $36,850.86) making Q1, 2016 my best quarter to date.
Overall I’m very happy with my first quarter income report of 2016, I hit my monthly goal of $10,000+ closed revenue for each of these first 3 months. I’ve got the momentum on my side and I’m heading into Q2 with fierce optimism. Let’s see if I can go 6 for 6 on my monthly goals, so far all signs point towards yes!
[separator type=”tall” size=”” icon=”usd”]
Okay, let’s wrap this thing up…
My income is public, and so are my websites. In fact, my portfolio is full of responsive websites for big brands and small businesses that are elegant, functional and highly ranked in search. This includes several websites that have scored a perfect 100/100 for mobile user experience when run through Google readiness tests. You can get the user experience score for your website by clicking here.
As a certified expert WordPress developer, I know what separates good sites from great ones and I’d be thrilled to help ensure that you get the most from your content on every device. If you’re ready to start converting your website’s visitors into customers, then it’s time for you to click the button below.
Or, if you’d prefer to post your next task publicly for both my colleagues and myself on Codeable, then I’d certainly encourage you to click here and receive $10 off your next WordPress project today.
[actionbox color=”primary” title=”I’M READY TO START MY NEXT PROJECT!” description=”” btn_label=”Hire Nathan Today” btn_link=”https://nathanello.com/hire-me” btn_color=”white” btn_size=”big” btn_icon=”thumbs-o-up” btn_external=”1″]


