First things first, I’d like to warn you that this article contains my August 2015 monthly income report.
What that means is that this article talks about money… More specifically, it’s about money I’ve earned as a freelance WordPress developer working for Codeable during the month of August. If you’re not a fan of this topic then I’d certainly encourage you to visit my blog and choose another article of mine to read. Maybe you’d find it more interesting to learn why I publish my income reports in the first place? Spoiler alert: I believe transparency trumps secrecy.
I’d also like to mention that the intent of this article is to inspire, not to boast. This is my personal story, my journey, in becoming a freelance WordPress developer. My goal is to show other developers what’s possible through Codeable and hopefully inspire someone to pursue a fulfilling freelance career of their own.
Now, before we dive any further into this topic together we need to get on the same page about a few things. First, this isn’t some magic get-rich-quick, overnight success, pyramid scheme, fantasy nonsense. This is real income produced by completing real work for real clients. I earned $6,483.15 in August by working for it, not wishing for it.
Second, this is not a best case scenario by any means. The data found below is from my very first month as a part-time freelancer for Codeable. What I really mean by “part-time freelancer” is that I’ve still got my “real job” (at least that’s what my parents call it) building websites from a desk nine-to-five. I’ve had conversations with successful developers all around the world who’ve made freelancing their full-time job and have managed to earn quite a bit more than me in the same time-frame… Anyways, let’s take a closer look at the numbers now.
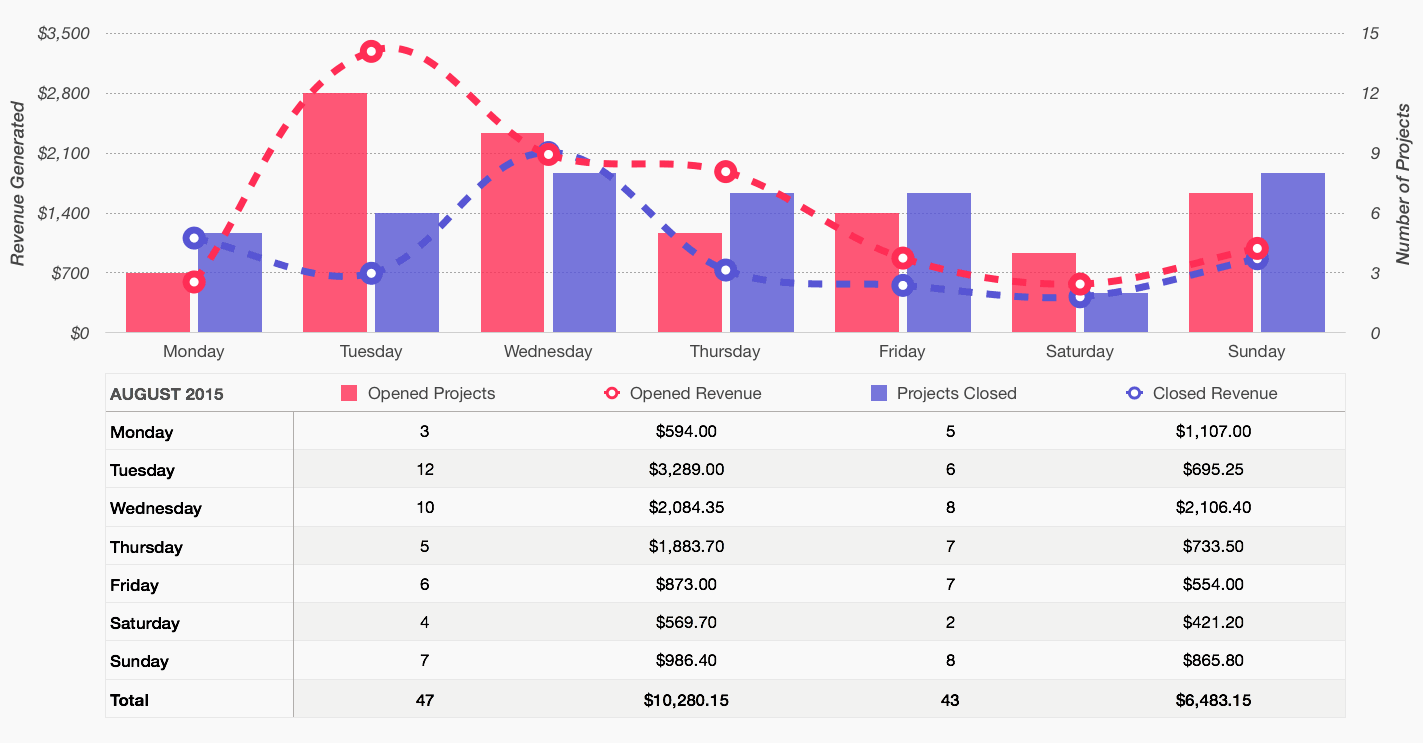 Opened projects refers to clients who have hired me to work on their projects while opened revenue represents the deposits they’ve placed for their work to be completed. Clients on Codeable deposit 100% of their project costs up front which is then placed into escrow until they mark the project as complete. Projects that have been marked as complete are showcased in my graphs as projects closed and closed revenue.
*Note: You can click on any of the graphs featured on this page to zoom in and see a larger version.
Codeable accepts just 4% of their applicants for a 30-day trial period. After their trial run, the developers who made the cut will officially receive their Codeable expert developer status and become part of the Codeable team. My 30-day trial started on Tuesday, August 4th which means that for August there was an even distribution of weekdays (4 of each, see chart above).
During August I opened 47 new projects worth $10,280.15, making the average project value just south of the $220 mark. I also closed 43 projects which generated $6,483.15 of revenue for me. While I did open the most new projects on Tuesdays & Wednesdays, the highest paying projects were actually opened on Thursdays. 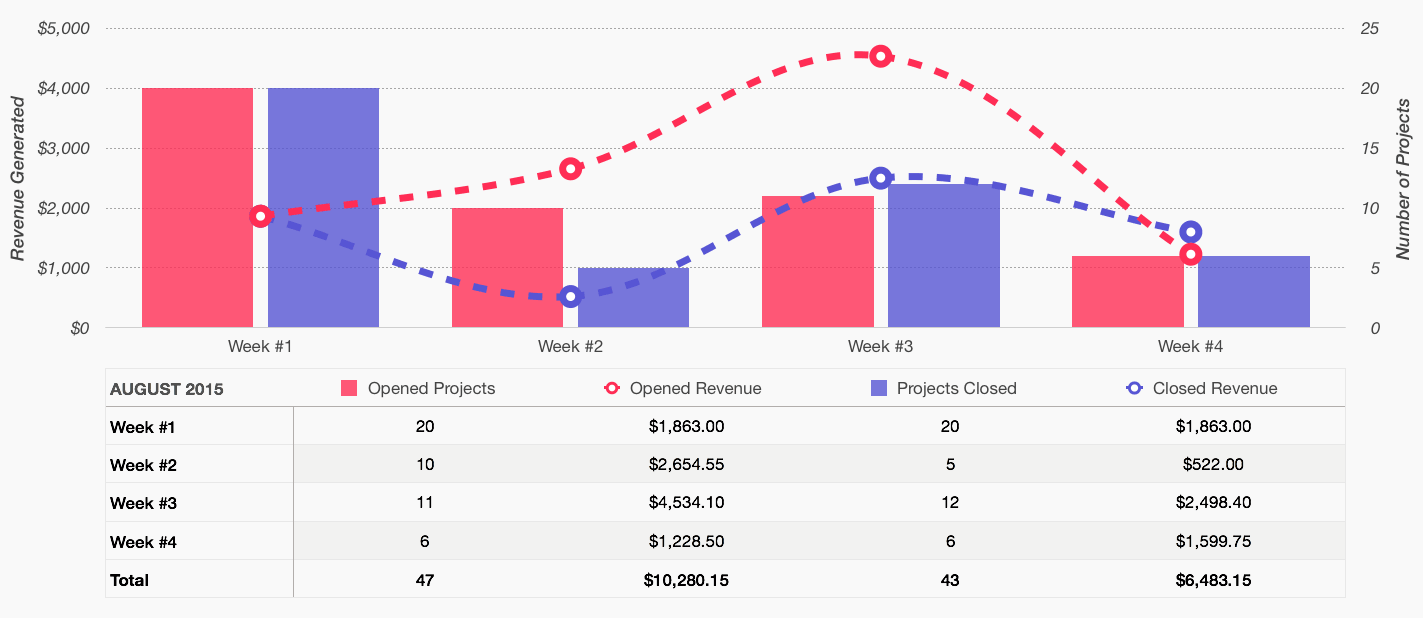 While charting the distribution of income by weekday looks cool and all, it’s not a very common nor practical way to track any real progress here. So, I’ve also created a weekly breakdown (the graph above) to help make a bit more sense out of all of this. If you’re anything like me then you might be interested in drilling this data down even further. You can click here to see my weekly income report or click here to see my daily income report for August 2015.
[actionbox color=”primary” title=”READY TO START YOUR NEXT PROJECT?” description=”” btn_label=”Hire Nathan Today” btn_link=”https://nathanello.com/hire-me” btn_color=”white” btn_size=”big” btn_icon=”thumbs-o-up” btn_external=”1″]